
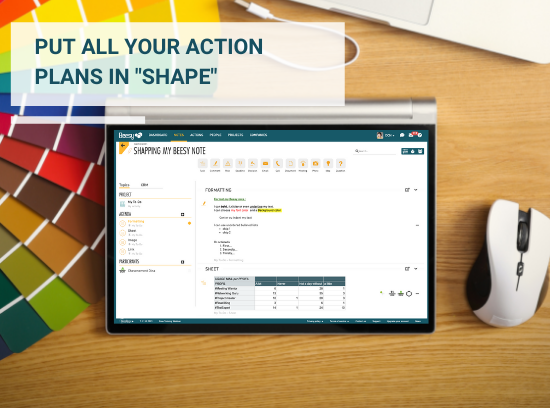
June 2021 You can now format your note-taking! Modify the alignment and colors of your texts. Add images, links or...
Click to rate this post![Total: 1 Average: 5]
At BeesApps, our goal is to provide companies with complete and fully customizable management tools to facilitate activity monitoring and increase team efficiency. This month, we are pleased to present a series of new features in the dashboard to facilitate the animation and management of the activity of teams
This new widget allows you to have a graphical summary of the activity progress. You will be able to follow
the progress of your topics: completed tasks out of the total number of tasks
the weather of each subject: percentage of overdue tasks on the number of tasks in progress
Sunny : for a number of overdue tasks lower than 10%.
Cloudy : for a number of overdue tasks between 10% and 40%.
Rainy : for a number of overdue tasks higher than 40%.
You can create your weather forecast by objective, project, collaborator, note or subject.

All your Eisenhower, Note, Project, People or Action matrix views are now accessible from a smartphone.
Create tasks, take notes, view the progress of your projects directly from your smartphone.

This widget has evolved to allow you to have a chronological visibility for all types of actions, by due date or by creation date (news).
For example, you can track your completed deadlines or your risks by completion date, but also integrate into your project reports the tracking of your decisions by creation date.

1 – A new menu bar for easier access to your dashboards:

2 – You can now view all your widgets by goal: the distribution of your goals with a pie chart, the progress of your goals with a bar chart, the load plan of your goals, the weather forecast of your goals or the list of your actions by goal….
.3 – If you only want to see the activity on a part of your goals. You can also filter your different widgets for one or more goals with the filter and goal option.
4 – You can also sort your activity information by column in your To do list, Weather or Load plan widgets.

– In your dashboards, when you click on a task, you can now access the note or project to which the task is attached.


Nowadays, it is important to have the right project management tool. The development of remote working, the diversification of tasks to achieve, working in agile or collaborative mode now make it necessary to use a project management software. Optimizing our...

According to SaaSList, 46% of team leaders experience difficulties completing their projects on time, but why? In this article, you will find out the 5 most common mistakes in terms of project management and the solutions to prevent them: 1 - Neglect the Pre-Project...

Who has never dreamed of working from their bed or sofa? Save time on transports, avoid traffic jams, take advantage of this time to devote it to your family or hobbies... But beware of preconceived ideas about home working. Discover here our 8 good resolutions to...